I never read Walden, not in its entirety anyway. I read most of the first chapter. It was dreadful. I still remember struggling to keep up with the narrative and wondering why is this such a big deal. Overall, I love the message of the simple life, civil disobedience, and living as one with nature. I do not love the apparently hypocritical obsession with seclusion and the disdain for all humanity. But this, of course, is a very shallow view of Thoreau. But then again, I do not have the patience to study him deeply. Fortunately, Kathryn Schultz and Jedediah Purdy do and offer an indictment of the man and somewhat halfhearted defense.
I really enjoyed reading both of these, but perhaps not surprisingly I found the indictment more convincing. The defence goes something like this. Sure, Thoreau was a hypocrite and an asshole, but we should not blame the message for the messenger (i.e. ad hominem or an opposite of blaming the messenger) even though in this case it happens to be the same person. I can get behind this argument. In science and in business there were and surely are lots of arrogant assholes, who nevertheless made important contributions. John Nash, despite a very favorable portrayal in the movie Beautiful Mind (the book is much less flattering), was not a very nice man. Steve Jobs was no sweetheart either. And so on. So, is Thoreau’s message important enough to stand on its own? That I am not qualified to answer, but a contrarian and anti-authoritarian in me wants to believe it that it is.
Thanks to Bryan Lewis for pointing me to these articles on his web page.
In 2012, I wrote a post about how to learn applied statistics without going to grad school. I still think that one does not have to spend a large amount of money to acquire the skills necessary for data analysis. What has changed for me personally is that am finding traditional statistical methods, call them classical or frequentist, or evolved classical based on the Stanford Statistical Learning school or whatever, somewhat unsatisfying.
These generally rely on maximum likelihood estimation (MLE) to generate point estimates and asymptotic properties of estimators to come up with confidence intervals. One of the main issues I have with this approach has nothing to do with MLE versus Bayesian full posterior per se. It has something to do with the fact that the Likelihood function is largely hidden from my view, although there are lots of others issues, some of which I hope to discuss when my understanding sufficiently progresses. I am getting too comfortable just running glm(), ok, not glm() since there is no regularization there, but say glmnet or Random Forest or even bayesglm in R. The latter is of course Bayesian, but still a black box.
I am not sure at this point if I am ready to abandon all the mathematical and algorithmic machinery of Lasso, Random Forests, Gradient Boosting Machines, and so on, but I would like to spend more time thinking and expressing models directly rather than running and tuning abstract algorithms. I am also quite certain I don’t want to write my own model fitting, sampling, and optimization procedures.
Since I would like to approach this problem in a Bayesian way, it also means that my goal is to get to the distribution of the parameter vector \(\theta\) given data \(y\), \(p(\theta | y)\), the posterior. In the Bayesian framework, we still work with the likelihood function \(p(y | \theta)\), but we are not trying to find some unique set of parameter values for which it is maximum (i.e. under which y are most likely.) Instead we want a complete picture of the uncertainty in our parameters that is supported by the data \(y\), our choice of the model (i.e. likelihood, which as Andrew Gelman likes to point out is a form of prior knowledge) and knowledge about the parameters (prior distribution) without relying on asymptotic properties of estimators. In short:
Getting from prior to posterior is hard work unless they happen to be in the same family, which is rarely the case in the wild. The natural question then is where to start. Short of coding everything from scratch, which would be a very long project, even if I knew how to do it, two types of tools are in order: a probabilistic language capable of expressing models, parameters, priors, and their relationships and an MCMC sampler that can get us to the posterior distributions numerically. For a while, the best bet was some flavor of the BUGS language which uses Gibbs. But the state of the art has moved away from Gibbs sampling. All the cool kids these days are playing with Stan which uses a more efficient, Hamiltonian MCMC with NUTS sampler and supports a broader set of models.
To get a jump start on Stan programming, I recently attended a class on Bayesian Inference with Stan taught by Andrew Gelman, Bob Carpenter, and Daniel Lee (thanks to Jared Lander for organizing the class.) I learned a lot and I hope to continue my exploration into Stan and Bayes.
* Thanks to Bob Carpenter for looking over the draft of this post and providing helpful comments.
After a 20 minute ride to the Jamaica Queens from Penn Station on the LIRR I am at the JFK. LIRR is really the best way to travel to JFK from the city. My flight leaves at 10:20 pm and the check-in procedure is quick an painless. I noticed that Lufthansa clerk did not check if I had a Kazakhstan visa.
It is approximately 7 hours to Frankfurt, one hour layover and another 5.5 hours to Astana. The flight was smooth and the airline food was surprisingly bearable. On the flight to Astana three Russian woman were sitting next to me talking about a Government congress that they were either organizing or actively participating in; their enthusiasm for navigating the local bureaucracy was noticeable but alas not infectious. Their command of the English language was impressive.
We landed in Astana at 12:30 AM local time, right on schedule. Anton, a grandson of repressed Polish people living in Russia during the Stalin era, met me at the gate. 20 minutes later we were in downtown Astana.
First day in Astana
A few hours of sleep and I was up and ready to soak in the local culture. After acquiring a local sim card and telephone for $26 (4,000 ten) we visited the Pyramid and Court of Independence. Astana has an architectural plan, displayed on the third floor of the Castle of Independence spanning 18 years through 2030. The plan is to build a capital of Asia that would rival it seems the Arab Emirates.
The Pyramid is a magnificent structure taking the shape according to its name. Several floors displaying (artwork?) culminate with a garden, leading to a small auditorium at the apex. There, the world religious congress is being held every three years and representatives from world religions meet in a friendly atmosphere. This was the first sign of religious tolerance and celebration of cultural diversity that I have encountered in Astana. It was one of many.
After visiting the Pyramid Anton and I have taken a short walk across the street to visit the Court of Independence. It is another enormous structure of marble inside and out. The interior looks so polished that the floor ornaments reflect light making me feel like I am walking on an opaque mirror. An excursion organized by the staff takes us along the atrium to a set of stairs leading to the second floor. There, a small art gallery displays the works of local, American, and French painters, none familiar to me. I am particularly fond of the local painters depicting the nomadic lifestyle of the region.
Bayterek
Bayterek was the first building that marked the beginning of the massive construction project undertaken by the president of Kazakhstan. Incidentally, his pictures and portraits are splattered all over Astana in museums, road signs, and government buildings. Normally this type of propaganda is a sign of deep political corruption, which may indeed be the case, but in Kazakhstan common people seem to have a lot of respect for the president.
When I asked a tour guide at the top of Bayterek what she thought about the planned expansion of the city, she said that it would continue due to the will and ideas of the president, “may god bless his soul”. Her opinion was seconded by Anton, albeit not as enthusiastically. He thinks that even though Nazarbaev is the king of Kazakhstan, his policies of pluralism and his support of national diversity enables the peoples from 150 or so religions and nationalities to coexist in peace and mutual respect. This is not a small feat and the president should be applauded for this, irrespective of his motives.
Visit to the Chabad House
The tour guide at Bayterek mentioned that among other religious institutions, Astana has a large synagogue. I was surprised to hear that, since I knew that very few Jews live in Kazakhstan. Naturally, I was excited to see it with my own eyes. The Astana Synagogue is in fact an impressive building of white and blue on the (Left) side of the city (Astana is divided in two informal parts by the river Ishum. The new construction is on the right bank of the river if you are facing (North?))
This Synagogue is fact part of Habad, a Hasidic organization whose mission is to attract more Jews into the religious practice. It is the only branch of orthodox Jewry that is welcoming of secular Jews. The building is guarded by a perimeter fence and a security guard at the front gate. After informing the guard that I would like to visit the Synagogue, he politely motions me inside and leads me up the stairs into the entrance. Anton follows me in.
The Synagogue is empty at 2 PM in the afternoon. The guard informs the Rabbi of our arrival and in less than 30 seconds he appears smiling, sporting an obligatory long beard, white shirt, and a Hasidic hat. He is clearly happy to see us, and after inquiring if I were Jewish (he did not ask Anton, who looks very Slavic) hands both of us a yarmulke and invites us into the prayer hall.
My guess is that the room sits approximately 50-100 people at the main level and another 20 or so on each balcony dividing the space into separate sections for men and women. Men can not focus on higher thoughts and prayers when women are too close, he explains. I think he is right about that.
After he finished explaining the building attributes, I see that his excitement is starting to grow as he informs me that a big mitzvah is about to be performed. He runs to the back and promptly returns holding a black box containing a tefillin. I am a little bit squeamish, but he is so persistent that I submit and let him wrap my left hand with a flat leather rope, while placing a wooden box on my head. I repeat his words of prayer as he performs the procedure.
When he is done, he informs me that he knows of 200-300 Jews that live in the city. For a city of 700,000 this is indeed a minority. Regular services usually gather 3-6 people and they only achieve minyan on Saturdays. Despite of a small congregation they publish a woman’s magazine and Jewish calendar. After giving Anton and I a copy of each, and asking us if we want something to eat or drink he politely escorted us back to the entrance. Please, come back whenever you are in town, he said to me. You as well, he said to Anton.
Trip to ALZHIR
Before coming to Kazakhstan I knew that if I only could visit one site in Astana it would be ALZHIR. The camp lies 20 km East of the city in a village that was called Molinovka (meaning made from raspberries). It was part of Soviet Gulag system from 1937 until shorty after Stalin’s death in 1955. The system is commonly referred to as Gulag Archipelago due to Aleksandr Solzhenitsyn. ALZHIR’s significance is not that it housed political prisoners convicted under Article 58 of the NKVD code, but that it housed their wives and children under the age of 3 (children that were 3 years old or older were separated from their mothers and their siblings and sent to a ‘det dom’: a children’s house that is roughly equivalent to a penitentiary for juvenile delinquents).
The road to ALZHIR (Akmolinki Lager’ Zhen Izmennikov Rodini: Akmolinsky Camp for the Wives of Traitors to the Motherland) is a deteriorating Soviet era asphalt road with enough bumps and cracks to ruin the suspension system of a modern tank. After about 30 minutes of bumping and grinding we arrive at the camp. As we approach the main building, the first item is in the front right – a Soviet rail car used in transporting women from all over the Soviet Union to ALZHIR.
These wagons were manufactured in Odessa, Ukraine from 1928 to 1929 and women spent more than two months inside while being transported to ALZHIR. The wagon is approximately 7×3 meters (23×10 feet) and housed over 70 prisoners. Many had to stand and sleep on top of each other.
To the left, a monument commemorating the victims.
The barracks have been destroyed and the only surviving structure is the guard tower with the museum building in the back.
Over 17,000 women were held in the camp, many have died from malnutrition and 18 hour work days. Their bodies were dumped into a mass grave behind the camp. Among the prisoners were noted Russian intellectuals and artists including Rachel Messerer, the mother of a famous Russian jewish ballerina Maya Mikhailovna Plisetskaya.
Inside the museum the story of the prisoners unfolds. While still in Moscow, the women were told by the authorities that a rendezvous with their husbands was being arranged and asked to come to the prison building for the meeting. Many were so happy that they wore red dresses and makeup in anticipation. When they arrived, they were escorted to the ‘waiting area’. Many never saw freedom again. They were read their charges, asked to admit that their husbands were traitors, separated from their children, and packed into wagons for transport to ALZHIR.
While at the camp they built their own barracks from straw and clay that could be found on the outskirts of the camp. The women also made their own clothes and later made uniforms for soldiers during the Second World War.
One day, while collecting straw, a group of local Kazakh men and women came by. They watched them work and then started throwing what appeared to be small bricks and stones at the prisoners. The guards were laughing. Even the locals know that you are traitors, they said. One of the women picked up a small brick. It was made out of bread.
When we left the camp, I asked Anton to stop in the middle of the steppe.
In March the steppe is still covered with ice as temperatures can fluctuate between -30 (c) and -10 (c). I walked on the other side of the road and stepped onto the brittle snow. Even though it looked solid, my legs went in knee deep. For a while I just stood there breathing cold air and getting lost in the serenity of infinite spaces stretching for hundreds of miles in all directions. The Kazakh flatland is calming and magnetic. How was it, asked Anton when I got back in the car. It was magical, I said. Finally, I felt like I was in Kazakhstan.
Jacki and I just submitted the first two chapter to our publisher, so I would like summarize early lessons learned (actually we submitted one chapter, but the editor decided to break the chapters in half; a decision that we fully support.) The chapters includes material on programming style (from R’s point of view), introduction to functions and functional programming, some information on S4 classes mostly from user’s perspective, vectorizing code, debugging and various methods of data access including web scraping and Twitter API.
First the obvious. We underestimated the amount time required to produce the content. No surprises there.
We spent too much time wrestling with the outline. Outlining seems to work well when I know my own writing style, but not so well otherwise. At some (earlier) point we should have just started writing and figured out the detailed chapter structure as we went along. I suspect this will change as we get deeper into the material, but only time will tell.
What does need to be planned is the immediate section. For me it helps to have all the code written and all the visuals produced prior to starting writing. When I tried writing code on the fly, I struggled to make any meaningful progress.
Lastly, it would have really helped if we read each other’s sections more carefully both in terms of synchronizing content and writing style. I hope that the final product does not read like the book was written by two people.
My co-author, Jacki Buros, and I have just signed a contract with Apress to write a book tentatively entitled “Predictive Analytics with R”, which will cover programming best practices, data munging, data exploration, and single and multi-level models with case studies in social media, healthcare, politics, marketing, and the stock market.
Why does the world need another R book? We think there is a shortage of books that deal with the complete and programmer centric analysis of real, dirty, and sometimes unstructured data. Our target audience are people who have some familiarity with statistics, but do not have much experience with programming. Why did we not call the book Data Science blah, blah, blah…? Because Rachel and the Mathbabe already grabbed that title! (ok, kidding)
The book is projected to be about 300 pages across 8 chapters. This is my first experience with writing a book and everything I heard about the process tells me that this is going to be a long and arduous endeavor lasting anywhere from 6 to 8 months. While undertaking a project of this size, I am sure there will be times when I will feel discouraged, overwhelmed, and emotionally and physically exhausted. What better vehicle for coping with these feelings than writing about them! (this is the last exclamation point in this post, promise.)
So this is my first post of what I hope will become my personal diary detailing the writing process. Here is the summary of the events thus far.
A publisher contacted me on LinkedIn and asked if I wanted to write a book.
Jacki and I wrote a proposal describing our target market, competition, and sales estimates based on comparables. We developed an outline and detailed description of each section.
We submitted our proposal (to the original publisher and two other publishers) and received an approval to publish the book from Apress’ editorial board. (Apress was not the original publisher. More on that process after the book is complete.)
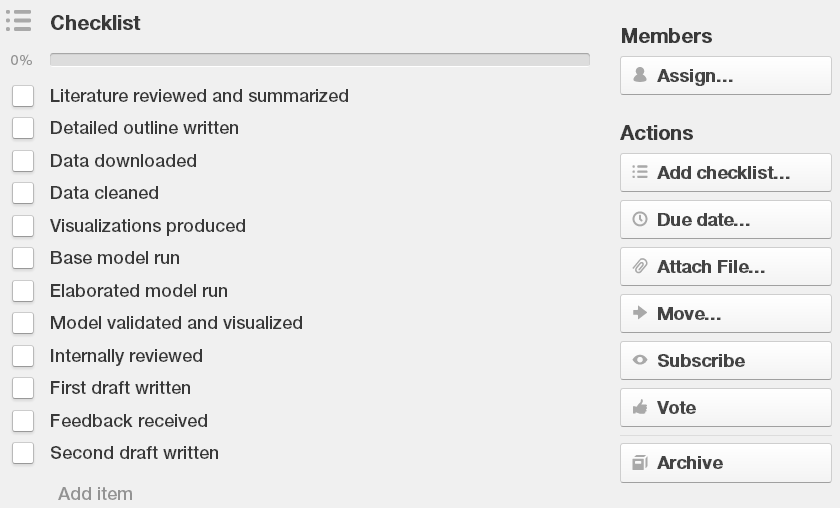
We set up a tracking project on Trello (thanks Joel and the Trello team), created a task for every chapter, and a included a detailed checklist for each task.
We have not completed all of the data analysis required for the book, so this is going to be an exercise in model building as well as in writing. If you have any advice about how to make the writing process better or if you think we are batshit crazy, please, post in the comments.
I hope to write a book that we can be proud of. We have a great editorial team and a technical reviewer who is kind of a legend in the R/S world. They will remain anonymous for now, but their identities will be revealed as soon as they give me permission to do so.
I am looking forward to learning about the writing process, about statistics, and about myself. Let the journey begin.
I remember the first time the concept of joint probability distribution was introduced to me I found it completely unintuitive (like so many topics in probability), declared myself too stupid to get it, and considered giving up on statistics.
The problem was that they used these silly gambling examples to demonstrate the concept. Flip of the coin this, roll of the die that. Urrg. Once I reset it in the context that I could relate too, everything became easier. So here we go.
Suppose you are a B level celebrity in London. Then suppose that the probability of you having sex on any given day is ⅔ (it would be virtually 1, if you were an A level celebrity in LA, but that would not make for interesting example). Also, suppose that the probability of a cloudy day is ⅘. Here is how we write it in the language of probabilities.
X is a random variable tracking our sex patterns. In this case, X can take on the values of X = Sex and X = NoSex. Y is a random variable tracking weather in London during the day. In our case Y = Cloudy or Y = Sunny.
It should be obvious that P(X=Sex) or P(X=NoSex) = P(Y=Cloudy) or P(Y=Sunny) = 1. The probability of the whole sample space is 1 in both cases (you either have sex or not or it is either sunny or cloudy). So P(X=Sex) + P(X=NoSex) = ⅔ + ⅓ = 1. By the same token P(Y=Cloudy) + P(Y=Sunny) = ⅘ + ⅕ = 1.
In this analysis, we assume that the sex is independent of the weather, an elusive assumptions and the one that should not be confused with correlation. I will try to make the differences clear when I discuss conditional independence. OK, here is the punch line. When we say joint probability distribution, we mean the probability of the combination of the events in question. For finite and discrete random variables such as the ones we are talking about, we can summarize the joint distribution using a table.
Sum = 1
P(X=Sex) = 2/3
P(X=NoSex) = 1/3
P(Y=Sunny) = 1/5
P(X=Sex,Y=Sunny) = 2/15
P(X=NoSex,Y=Sunny) = 1/15
P(Y=Cloudy) = 4/5
P(X=Sex,Y=Cloudy) = 8/15
P(X=NoSex,Y=Cloudy) = 4/15
In the above table when I write P(X=Sex, Y=Sunny) I mean the probability of both sex AND cloudy weather. (Do not confuse this with a notation P(X | Y), which means that we are only interested in Sex given a particular Weather outcome had already occurred.) This is why it is called joint probability. The probabilities listed in the margins of the table, are called … marginal. Each value in the cells is the product of two marginals. For instance the probability of having sex while it is sunny is ⅔ * ⅕ = 2/15. The cool thing is that if you observe only the joint probabilities you can easily calculate the marginals by summing across rows or columns (the reverse does not work – you can’t get joints from marginals, but you can get them from a good dealer in the Bronx.)
So, if I observe you, the celebrity in question, for 150 days having sex during 20 sunny days and 80 cloudy days (you were not having sex during the other 50 days, sorry), I may conclude that the marginal probability of you having sex in London is 2/15 + 8/15 = 10/15 = ⅔ = P(X=Sex) = P(X=Sex,Y=Sunny)+ P(X=Sex,Y=Cloudy), which is in fact consistent with our assumptions. This can be formalized as follows:
\(P(X) = \sum_{Y}^{} P(X,Y)\)
This rule is quite general (it is called the sum rule of probabilities) and it says that for any joint distribution X,Y to get back the probability of X we have to sum across all possible values of Y.
Try summing across other rows columns and you will see that results are consistent there as well.
As I am reading Rabbit, Run, I am slowly recognizing the literary genius of John Updike and I can not help but to draw parallels to the artists of the second kind — mathematicians. Updike does not use the tricks of literary construction that are so prevalent in the popular literature and modern blog writing. There is nothing wrong with clever literary construction of course. It makes the pages turn, it draws you in and leaves you asking for more. If you have read John Grisham’s Time to Kill (his first and best novel, I think), you know what I am talking about. The problem is that this kind of prose gets tiring after a while as you sort of feel like the author is consciously tricking you.
Not so with Updike. His storyline is quite ordinary as are his characters. He does not leave you hanging at the end pages and paragraphs. He simply tells. The beauty of his writing, it seems to me, is that the prose itself is so cleverly nuanced, yet so vivid, that it infuses extraordinary qualities into ordinary events and actors. For example, from Rabbit, Run, describing a foreplay with a plump prostitute:
As swiftly, he bends his face into a small forest smelling of spice, where he is out of all dimension, and where a tender entire woman seems an inch away, around a kind of corner. When he straightens up on his knees, kneeling as he is by the bed, Ruth under his eyes is an incredible continent, the pushed-up slip a north of snow.
When reading Updike, the reading itself is an incredible experience, a total escape into the Updike dimension that is as insightful as it is unique. This kind of prose seems completely out of reach for mere mortals who need to resort to literary tricks.
Cover via Amazon
I get a similar feeling when reading Henri Poincare’s The Value of Science (in English translation) in that his understanding of mathematics is so deep that it feels almost untouchable, yet he simply tells without the drama of other popularizers of science like say Hawking (a brilliant man) or Mlodinow (also no slouch.) Not to be outdone by the literary types, Poincare’s narration is so beautiful that it makes me want to learn French just to read him in the original. Here is Poincare on the nuances of Number Theory:
He is a savant indeed who will not take is as evident that every curve has a tangent; and in fact if we think of a curve and straight line as two narrow bands, we can always arrange them in such a way that they have a common part without intersecting
And here he is again on the scientific motivation.
The scientist does not study nature because it is useful; he studies it because he delights in it, and he delights in it because it is beautiful. If nature were not beautiful, it would not be worth knowing, and if nature would not be worth knowing, life would not be worth living.
It was Poincare who noted that:
A scientist worthy of his name, above all a mathematician, experiences in his work the same impression as an artist; his pleasure is as great and of the same nature.
The curious intersection of art and science has been noted by many. The fact that science has its own aesthetic beauty is not a byproduct of the scientific method. As Poincare so eloquently points out, it is the reason for its existence.
Producing informative and aesthetically pleasing quantitative visualizations is hard work. Any tool or library that helps me with this task is worth considering. Since I do most of my work in R, I have a choice of using plot, the default plotting library, a more powerful lattice package, and ggplot, which is based on the Grammar of Graphics.
There is usually a tradeoff between the expressiveness of the grammer and the learning curve necessary to master it. I have recently invested 3 days of my life learning the ins and outs of ggplot and I have to say that it has been most rewarding.
The fundamental difference between plot and ggplot is that in plot you manipulate graphical elements directly using predefined functions, whereas in ggplot you build the plot one layer at a time and can supply your own functions, although you can do quite a bit (but not everything) with a function called qplot, which abstracts the layering from the user and works similar to plot. And therefore qplot is exactly where you want to start when upgrading from plot.
To demonstrate, the following R code partly visualizes the famous iris dataset containing Sepal and Petal measurements of three species of Iris flower using the built in plot function.
One of the problems with plot is that the default plotting options are poorly chosen, so the first line of code fixed the margins, tick marks, and the orientation of the y axis tick labels. The parameter col=as.numeric(Species) + 1 fixes the color offset at Red as opposed to the default Black. Type palette() at the R prompt to see the default color vector.
The last complication is that plot does not draw the legend for you; it must be specified by hand. And so, if you run the above code in R, you should get the following output.
It took a little bit of work, but the output looks pretty good. Following is the equivalent task using ggplot’s qplot function.
qplot(Sepal.Length, Sepal.Width, data = iris, colour = Species, xlim=c(4,8))
As you can see, ggplot chooses a lot more sensible defaults and in this particular case, the interface for specifying the intent of the user is very simple and intuitive.
A final word of caution. Just like a skier who sticks to blue and green slopes is in danger of never making it out of the intermediate hell, so is the qplot user will never truly master the grammar of graphics. For those who dare to use a much more expressive ggplot(…) function, the rewards are well worth the effort.
Here are some of the ggplot references that I found valuable.
In the second semester of grad school, I remember sitting in a Statistical Inference class watching a very Russian sounding instructor fast forward through an overhead projected PDF document filled with numbered equations and occasionally making comments like: “Vell, ve take zis eqazion on ze top and ve substitude it on ze butom, and zen it verk out. Do you see zat ?” I did not see zat. I don’t think many people saw zat.
In case I come off as an intolerant immigrant hater, let me assure you that as an immigrant from the former Soviet block, I have all due respect for the very bright Russian and non-Russian scientists who came to the United States to seek intellectual and other freedoms. But this post is not about immigration, which incidentally is in need of serious reform. This is about an important subject, which on average is not being taught very well.
This is hardly news, but many courses in Statistics are being taught by very talented statisticians who have no aptitude or interest in the teaching method. But poor instructors are not the only problem. These courses are part of an institution, an institution that is no longer in the business of providing education. Universities predominantly sell accreditation to students, and research to (mostly) the federal government. While I believe that government-sponsored research should be a foundation of modern society, it does not have to be delivered within the confines of a teaching institution. And a university diploma, even from a top school (i.e. accreditation), is at best a proxy for your knowledge and capabilities. For example, if you are a software engineer, Stack Overflow and GitHub provide much more direct evidence of your abilities.
With the cost of higher education skyrocketing, it is reasonable to ask if the traditional university education is still relevant? I am not sure about medicine, but in statistics, the answer is a resounding ‘No.’ Unless you want to be a professor. But chances are you will not be a professor, even if you get your coveted Ph.D.
So for all of you aspiring Data Geeks, I put together a table outlining Online Classes, Books, and Community and Q&A Sites that completely bypass the traditional channels. And if you really want to go to school, most Universities will allow you to audit classes, so that is always an option. Got Zat?
Online Classes
Books
Community / Q&A
Programming
Computer Science Courses at Udacity. Currently Introduction to Computer Science, Logic and Discrete Mathematics (great for preparation for Probability), Programming Languages, Design of Computer Programs, and Algorithms.
For a highly interactive experience try Codecademy.
There is a small Ecuadorian cafe right outside of my apartment building. The beauty of living in Astoria Queens is that delicious, reasonably priced food is just a few blocks away. The owner, Claudio, is a good buddy of mine and cooks up amazing dishes like Pernil, Ceviche Camaron, and other Ecuadorian goodness. It is usually quite warm inside, with South American music playing in the background and clunking sounds of dishes and cutlery filling in the rest of the spectrum.
Beef Stew, Ecuadorian Style - $8 with Soup
Claudio’s brother Edgar helps run the place by chopping vegetables and occasionally stepping up to the stove. The place is small, usually a bit crowded and you get this feeling that these guys earn every dime the hard way. Always hustling, delivering lunches and dinners, but never forgetting to smile. Recently I had the following conversation with Edgar.
“Enrique, cómo está, my friend?”, says Edgar as I enter the store.
(Everyone there calls me Enrique. I think I might have said my name was Enrique, when we first met. They also sometimes call me Che Guevara. So it goes.)
“Bien, gracias, ¿y tú?”
(This is the extent of my Spanish)
“Very good; jost getting the lonches ready”
(He knows, that was the extent of my Spanish.)
Then after a while.
“Enrique, I want it to ask you so’mthin. You mens’ioned that you studied stateestics. I want to ask you, what should I do to get into this field.”
I feel embarassed. I never thought that he could be even remotely interested in the subject. So, like a total ass I proceeded with a question of my own.
“Oh yeah? Have you taken any math classes?”, I ask sardonically.
“Well, jes. I have taken Calculus I through III, Probability Theeory, Leenear Algebra, Differensial Equasions, Real Analysis I, Real Analysis II, Heestory of Mathemathics, and lets see. I have also taken Leenear Regression. They let me take graduate classes at Hunter, since I have done so well in my undergraduate ones”, nonchalantly answers Edgar, while wiping off the butcher’s knife.
OK, now I feel like a special kind of ass – a dumb-ass.
“Dude, you are much more qualified than I ever was. What can I do for you?”, I said trying to recover.
(I call a lot of people ‘dude’. Even my daughter. She once said: “I am not a dude daddy, I am a girl!”. “Whatever, dude”, came the reply.)
“Well, I was looking for graduate schools, but they are so espensive. I don’t think I can afford it.”
“You don’t need to go to graduate school, Edgar. I mean you can, but I think that you can get the skills necessary without it and perhaps learn even more.”
When I came home, I thought about how one would go about learning the subject without relying on the traditional venues. What if the person does not have Edgar’s math background?
The Teaser
The first question one usually asks when confronted with a new subject is why? The answer is that statistics will make you a better human being, no more, no less. As a side effect, it will help you make better decisions when confronted with uncertainty, which is pretty much always.
Here is a teaser. Suppose you are given two sequences of Boy/Girl births: BGGBGG and BBBBBG. Which one is more likely to occur? If you think that the first one is more likely, you are in the majority. You are also wrong, but not to worry. A casual investigation of probabilities will clear this right up.
Since, I am in the baby mood, here is another. A small rural hospital and a large urban hospital reported a ratio of boys to girls to be 0.70 on a given day. Do you believe this? Where is it more likely to occur?
Study after study shows, that we do not have the intrinsic intuition for probabilities. Nature, it seems, did not prepare us to live in a highly uncertain world. All of us need some help with this, some more than others. For example, if the right answer to this problem, is immediately obvious to you, you are either a highly evolved human being or an alien robot. In either case, I envy you!
The Tools
While discussing the subject, I purposely avoid terms like Machine Learning, Data Mining, and Data Science. A lot has been written about the subtle differences. If you care about that, here is one discussion thread. Also, see a related post from Drew Conwayhere.
There are three main threads I see that are needed to be an applied statistician. (Theoretical statistics is largely an academic discipline, and if you are interested in it and live in New York take a look here.)
PROGRAMMING: Statistics is becoming more and more computational. In the periphery, it is important to be able to prepare your data for analysis. At the core, a rapidly evolving, but old discipline of Bayesian Statistics seldom offers analytical solutions and the ability to program simulations becomes very important. Programming your own optimization algorithms, is also a pedagogical and rewarding exercise. Do you need to be a computer scientist? No, but it helps to think like one. If you have never programmed, read the first chapter and ignore the references to Python. More on programming languages later.
FOUNDATIONAL MATH: Despite Edgar’s love for Mathematics, a basic grasp of multivariate calculus, probability, and linear algebra is enough to acquire the skills and intuition necessary for applied statistics. If you want to dig a little deeper, Measure Theory, a branch on Real Analysis, helped solidify the foundations of probability. It is good to know it exists, but I would trust that it works, and put off the investigation till much later. If all this sounds daunting, don’t be alarmed. Anyone can learn enough math to understand what is going on. (I did, and I am no mathematician.)
STATISTICS: This will largely depend on the type of work you enjoy doing, but the core will include Linear Regression (like predicting income based on age, sex, education, and so on) and Generalized Linear Models (like classifying a tumor as benign or malignant, based on its size.) I would also recommend Time Series (used in climate models, economics and finance, among others.) Understanding of Markov Chains and Markov Chain Monte Carlo (MCMC) will be helpful for Bayesian Statistics. This list go on and on, but even if you master the first sentence in this paragraph, you are way ahead of the curve.
If the above sounds like a bunch of gibberish, do not be deterred. Because, so far I have not told you much. I listed and named the areas of focus, but I have not described the method. Where should I acquire these skills, using what mode of interaction, and in what sequence?
To give you a preview, I do not like the highly theoretical and sequential method used in the most graduate Statistics programs. In the next post, I will describe an alternative.
In the meantime, I am off to Claudio’s cafe. I hear he has lentil soup and goat stew cooking. (While I eat, Claudio is trying to convince me to follow Jesus. After sampling the food, I am starting to believe…)